

Key Takeaway: Market is healing beneath the surface, though at different rates across market cap levels.
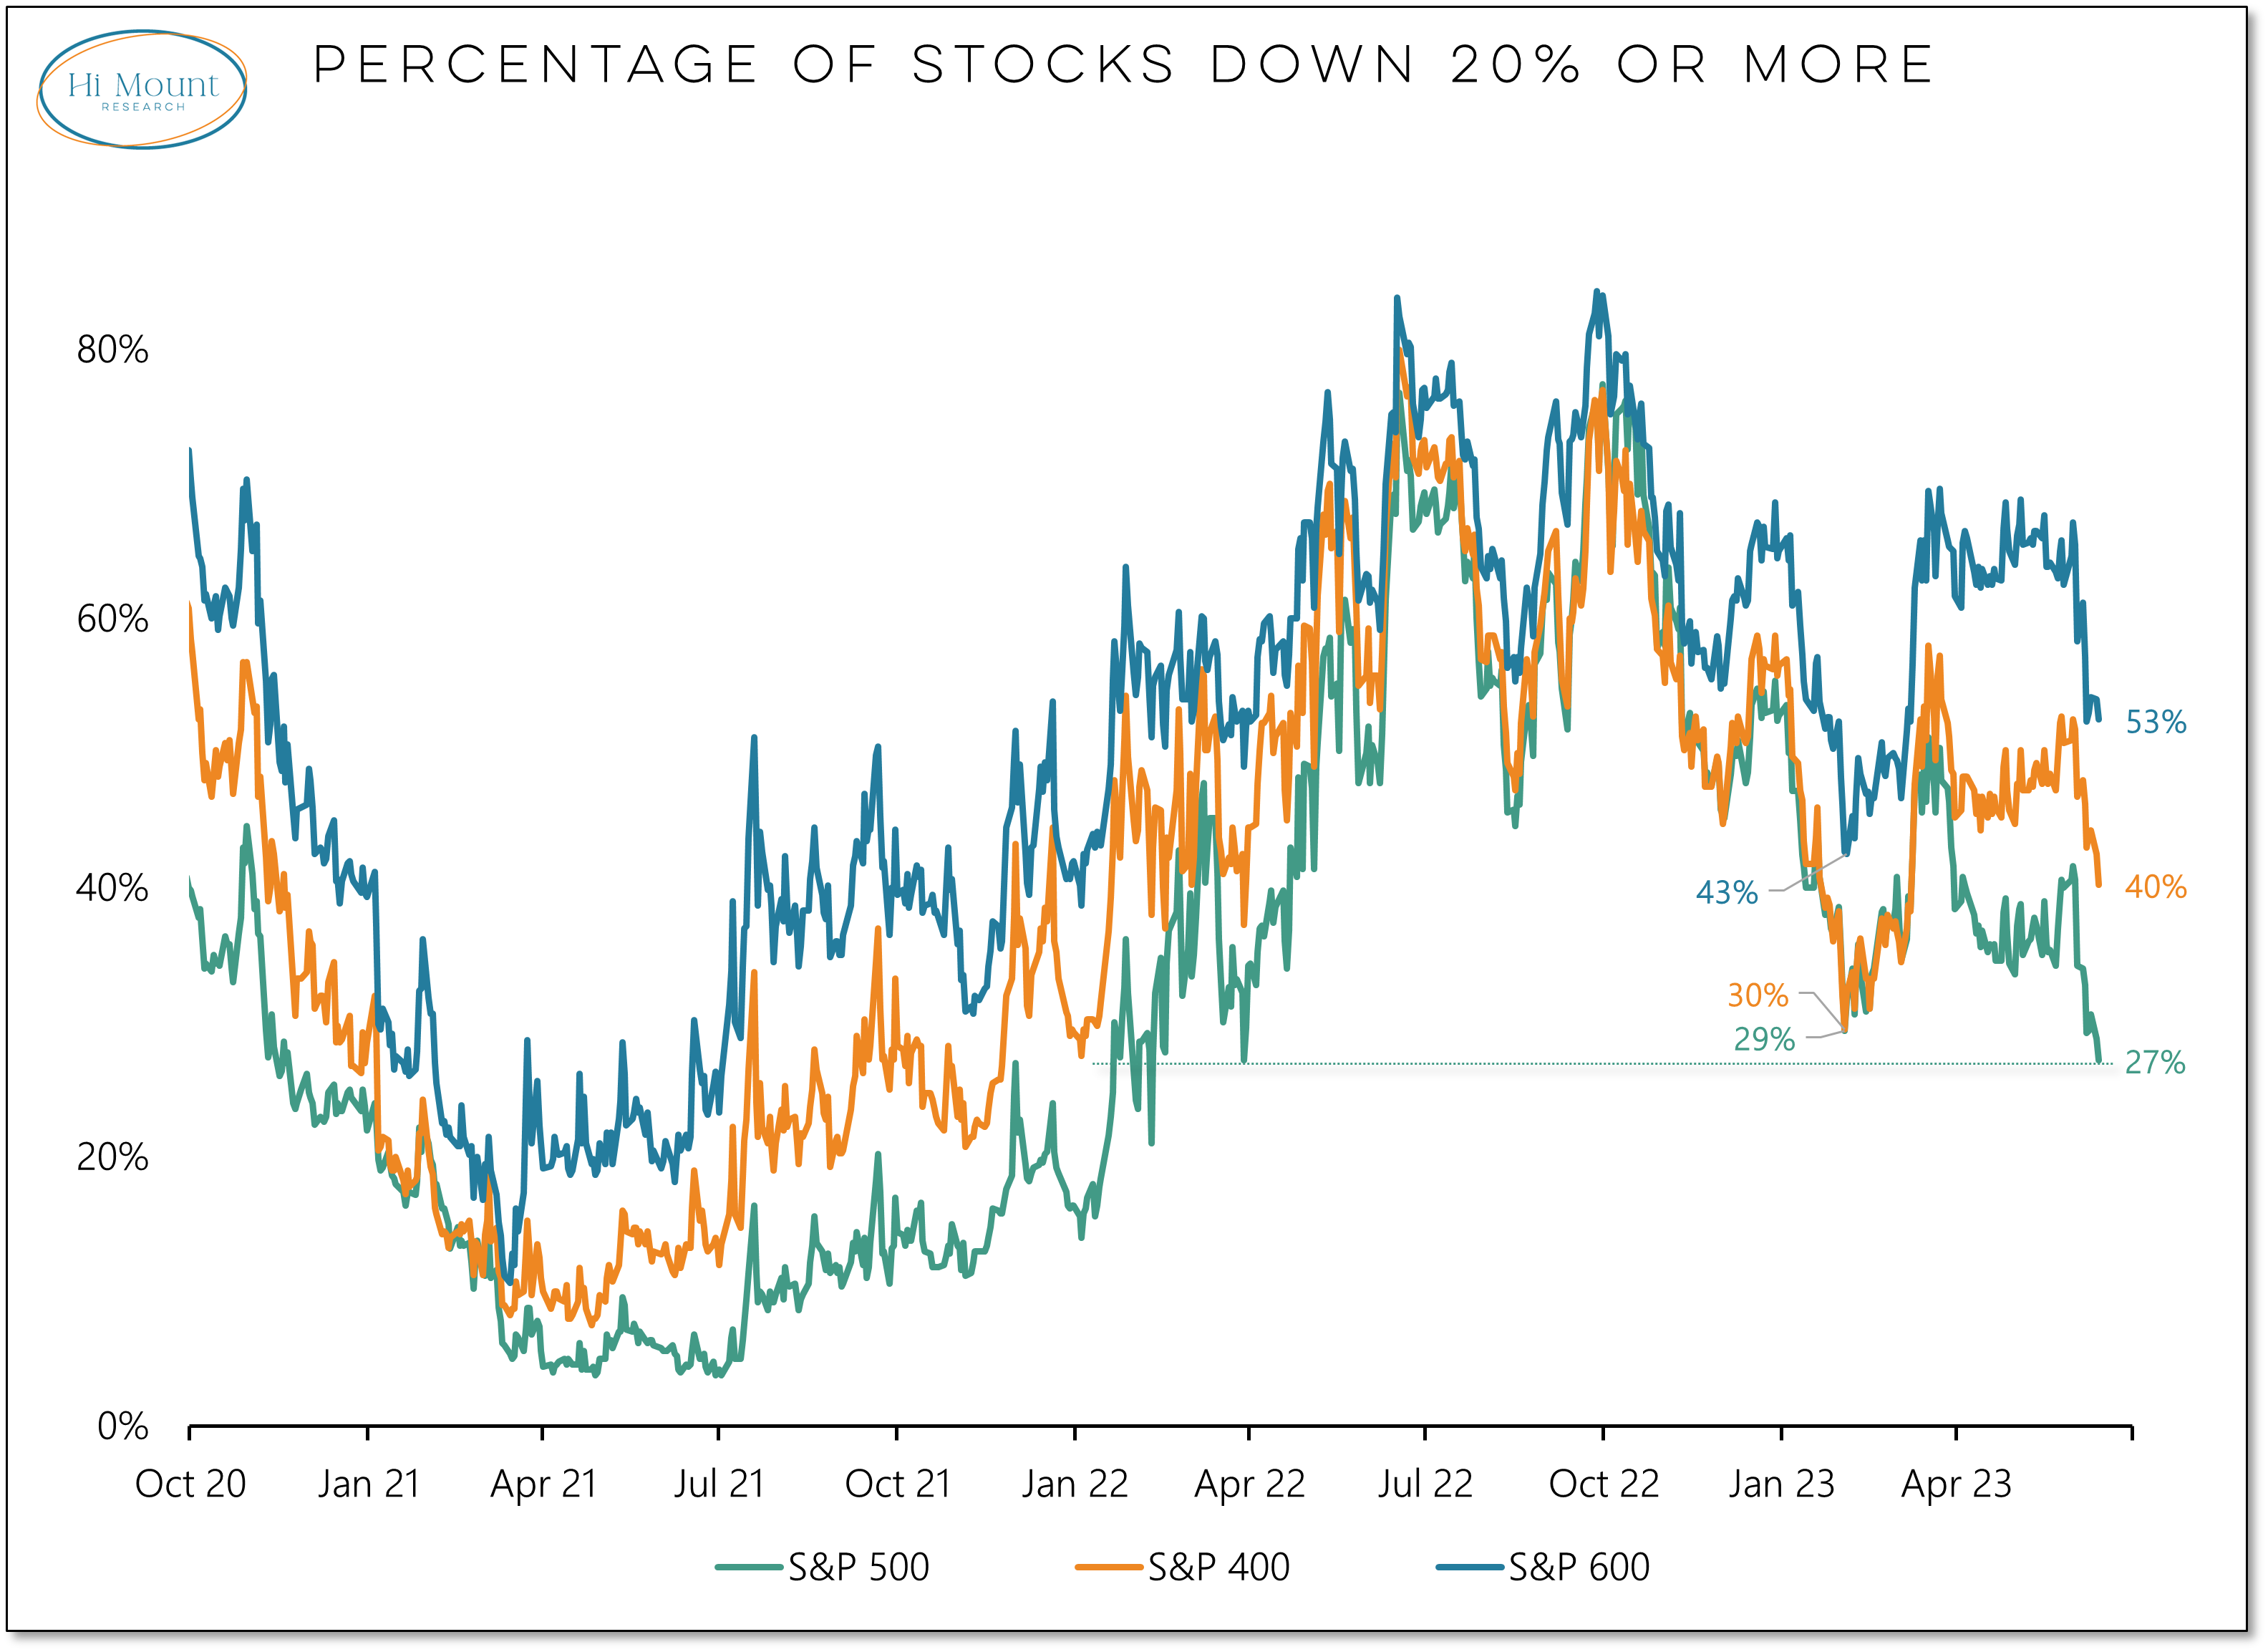
More Context: In February of this year, the percentage of S&P 500 stock in 20% drawdowns* dropped to 29%. For the S&P 400 (mid-caps) it dropped to 30%, while for the S&P 600 (small-caps) it dropped to 43%. That improvement proved to be short-lived and by March, all three indexes had between 50% to 70% of their constituents in 20% drawdowns. Now, the number for the S&P 500 has dropped below where it was earlier this year, and is at its lowest level since February 2022. For both mid-caps & small-caps, it’s heading in a favorable direction but is still higher than it was 4 months ago.
One More Point: At this point last year 80% of the stocks in these three indexes were in 20% drawdowns. Now it is just 40%. The path has been uneven, but conditions have improved.
*To be clear, there is nothing magical or decisive about the 20% threshold. Its usage allows for consistent comparison of market conditions over time. One could just as easily have picked another level and the shape of the picture would have been similar.
