

Key Takeaway: Breadth is improving and new highs continue to outnumber new lows. The tape turned higher in June and continues to provide a tailwind for the S&P 500.
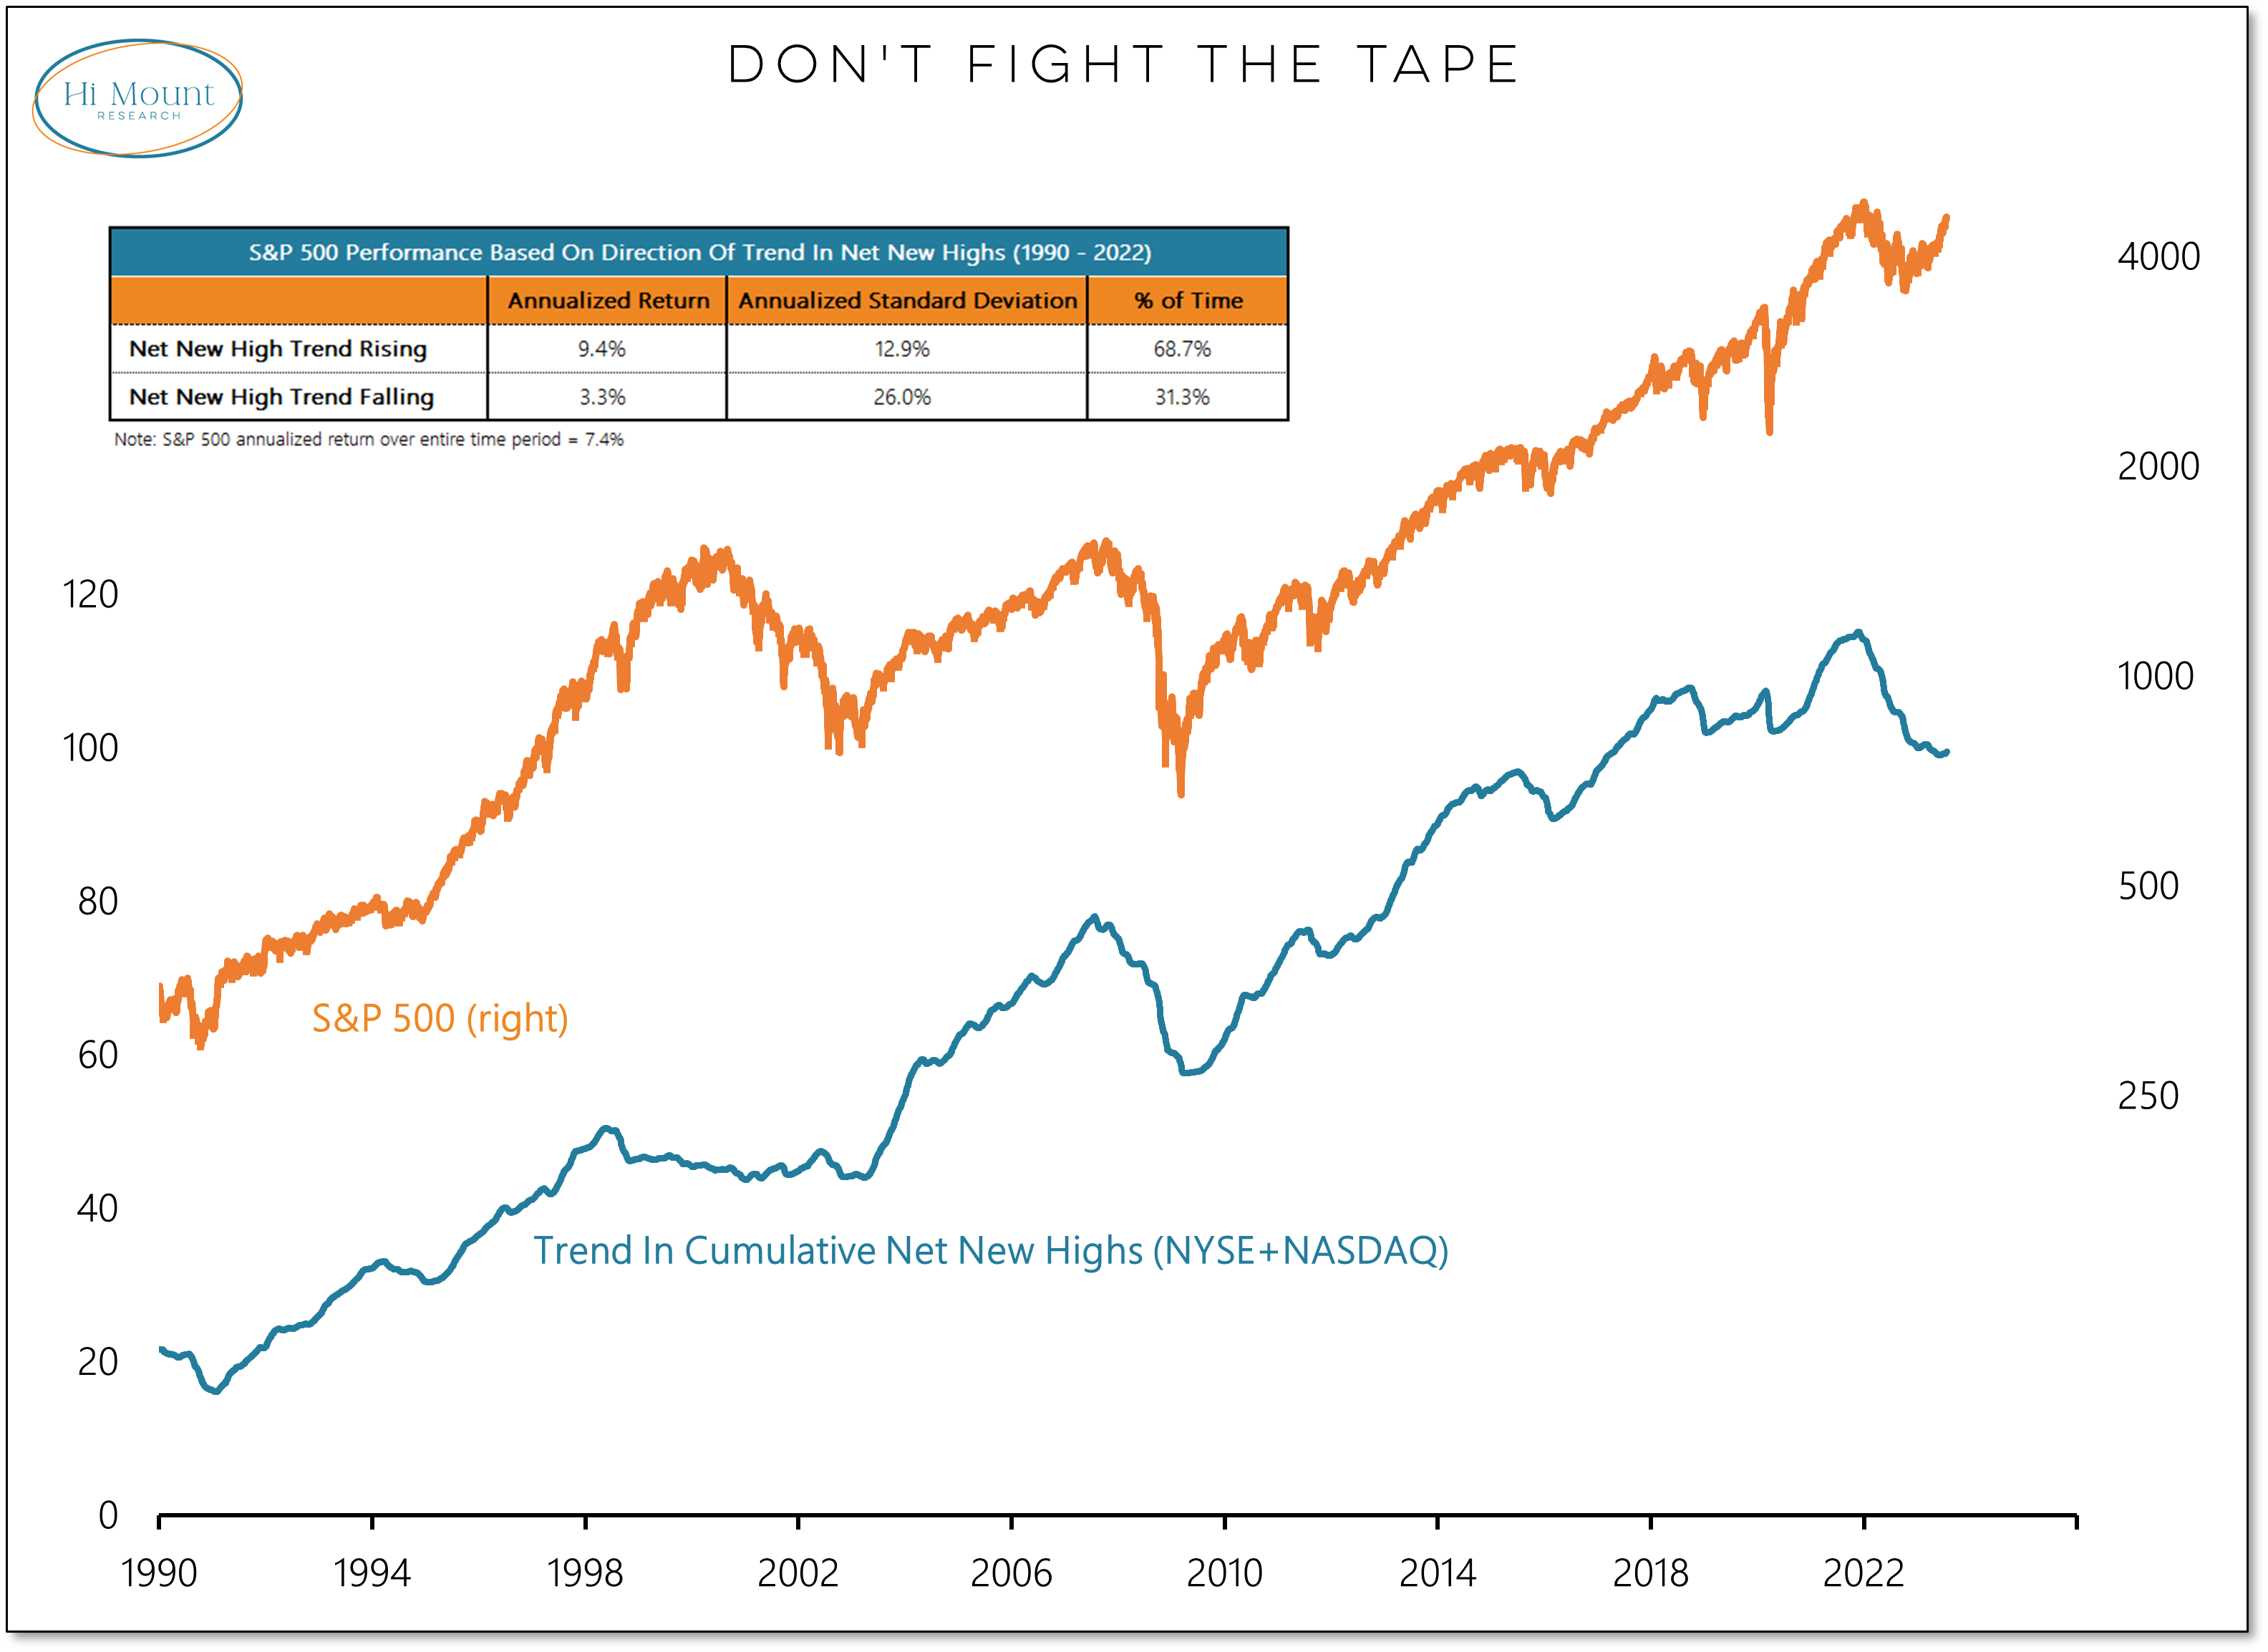
More Context: The chart above shows the long-term relationship between the S&P 500 and the trend in net new highs. When that trend is rising (as it has been two-thirds of the time since 1990), S&P 500 returns are above average and risk (standard deviation of returns) is below average. When the net new high trend is falling, S&P 500 performance suffers and volatility soars. It’s hard to see on this chart, but a zoomed in look at the trend in net new highs shows that it turned higher in early June and has been rising since (which is the longest sustained increase in the past two years but not at all historically extended). It might not catch every turn, but it does help keep investors in harmony with the underlying trend. Right now, it looks like that trend is up and to the right.
