What: After a one-week respite, the S&P 500 posted another gain of more than 1% last week. The index has gained more than 1% in 6 of the 7 past weeks, something that has happened only 12 previous times going back to 1950. More often than not strength has led to more strength.

So What: Index-level strength is being accompanied by broad participation.
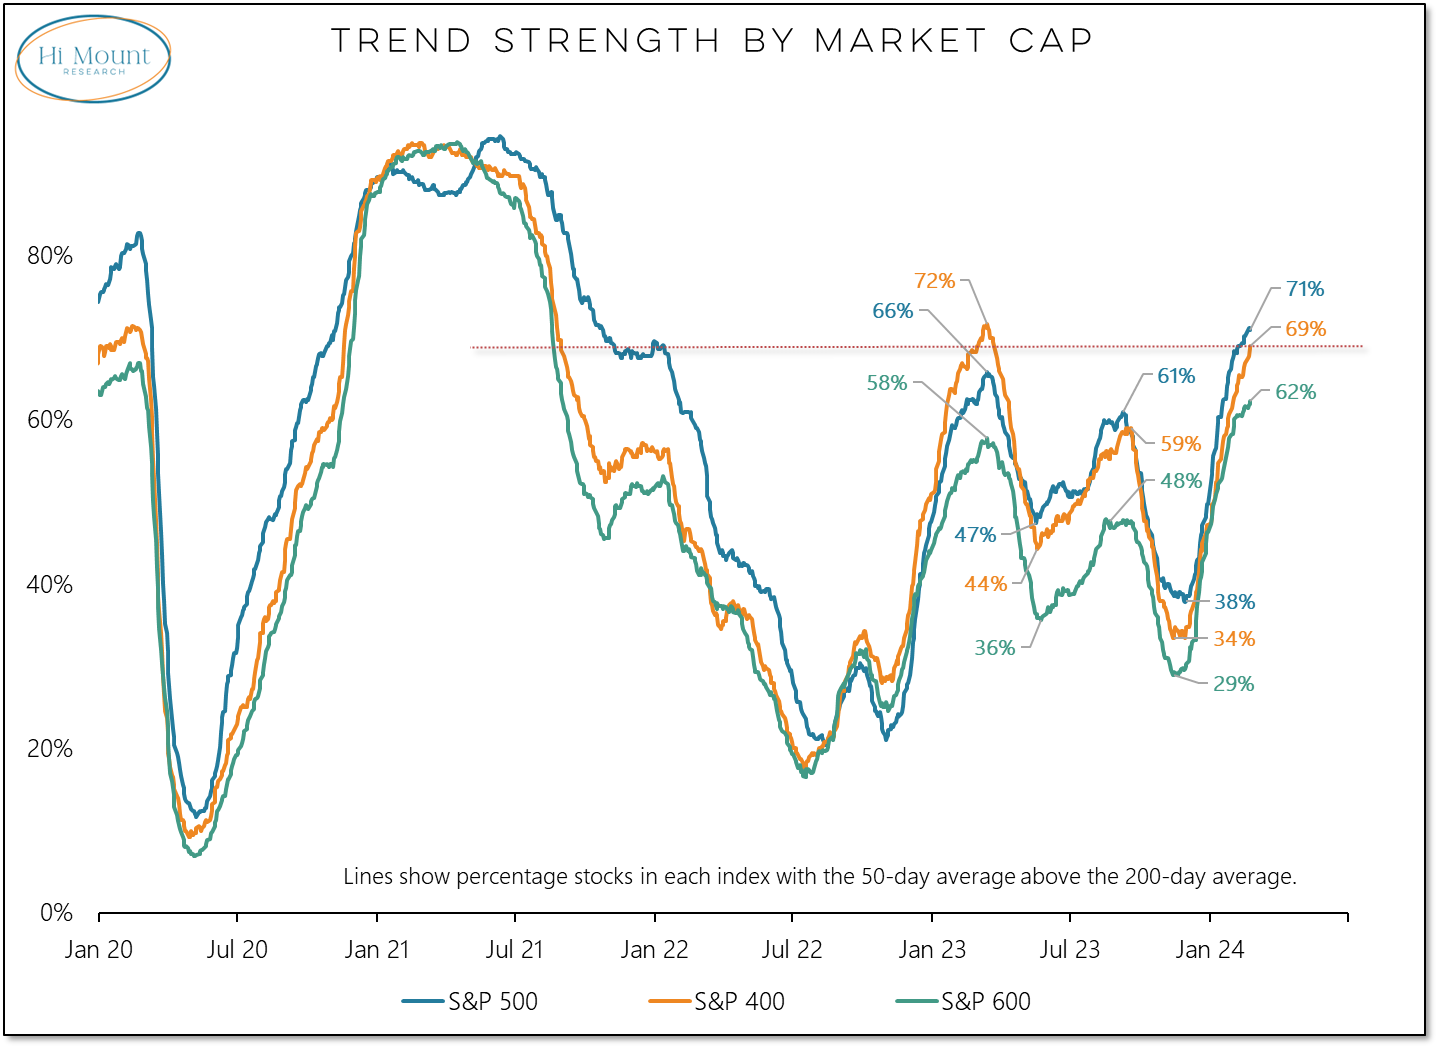
- Overall, two-thirds of S&P 1500 stocks have 50-day averages that are higher than their 200-day averages – the best level since September 2021. At the beginning of the year, it was less than one-half (it bottomed at one-third in November).

- More than a third of all S&P 1500 industry groups made new highs last week. That matches the December peak for the most in over two years.

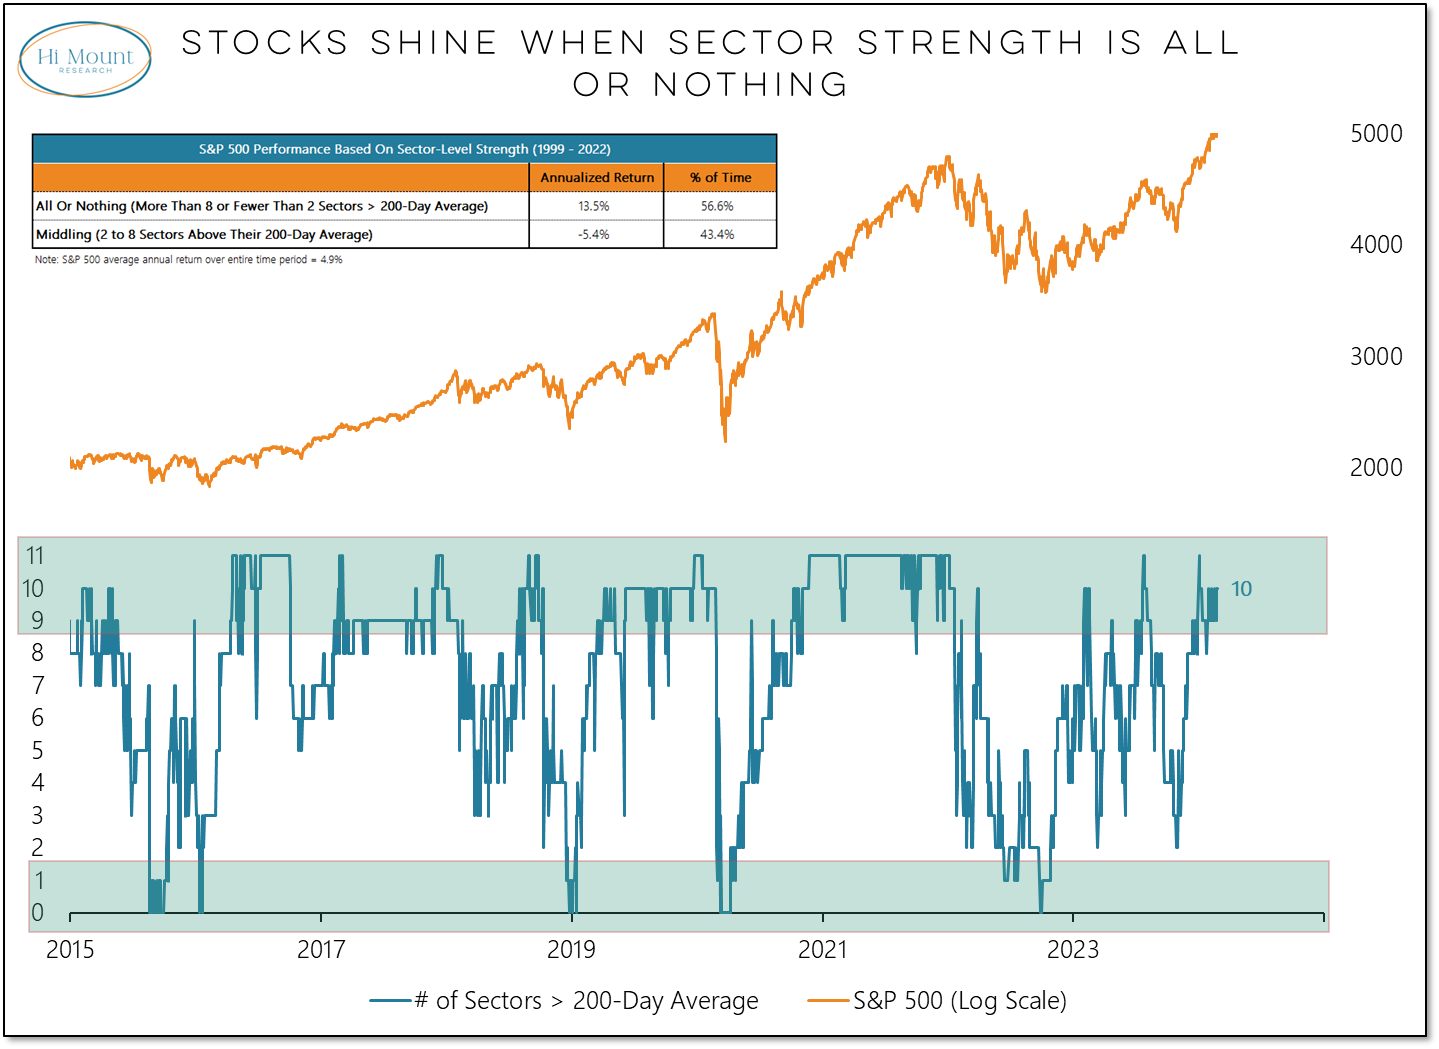
- 10 of 11 S&P 500 sectors are above their 200-day averages. That keeps our “All or Nothing” sector model in bullish territory.

Now What: With opportunities aplenty, we are looking for less concentrated exposure. Industrials are not only at the top of our equal-weight relative strength rankings, they are the most equally-weighted of the 11 S&P sectors. The top 5 positions in the Industrials sector only account for 20% of the total sector weighting. For the most top heavy sectors (Communication Services, Information Technology and, perhaps surprisingly, Energy), the top 5 account for 60% of the sector.


