Key Takeaway: Index-level strength paints the picture of a market that wants to push higher, while beneath the surface we see evidence of early year gains being given back.
More Context: The long-term trend for the All-Country World Index turned higher five weeks ago. Three weeks ago, the trend for the NASDAQ 100 followed suit. This week it was S&P 500 (and in our global asset allocation model, the MSCI US index) that joined the party.
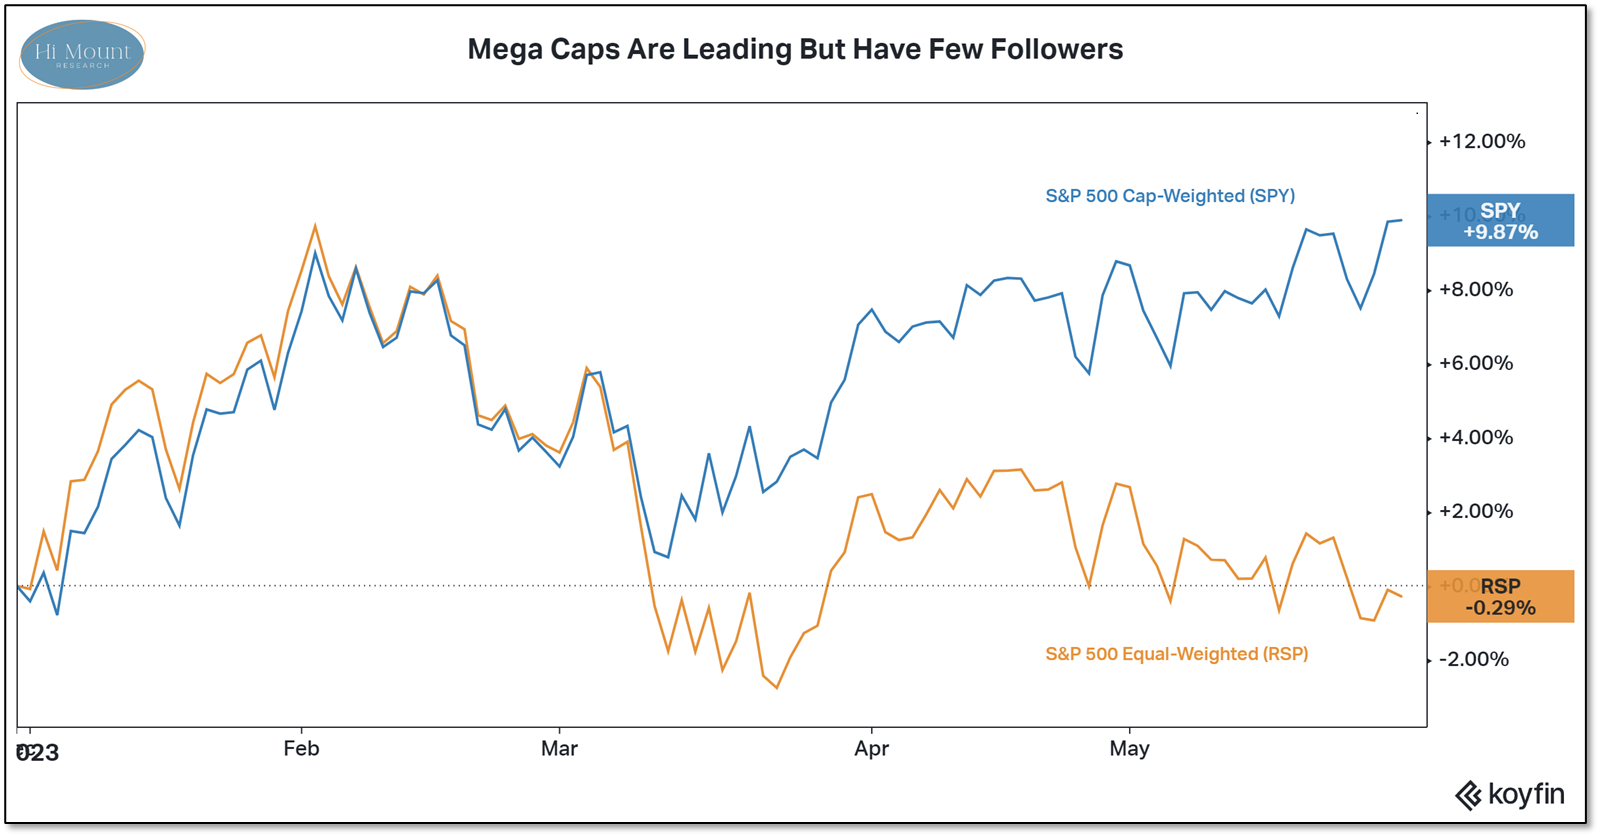
While the S&P 500 has moved back to its February high, the median stock in the index is underwater for the year. SPY (the cap-weighted S&P 500) and RSP (the equal-weighted S&P 500) have diverged since mid-March after beginning the year by moving in lock-step. SPY is back to being up nearly 10% this year while RSP has given back (and then some) everything it gained to start the year. The divergence between XLY (cap-weighted Consumer Discretionary) and XRT (equally-weighted Retailers) is even more dramatic. Year-to-date, XLY is up 16% and XRT is down 6%.

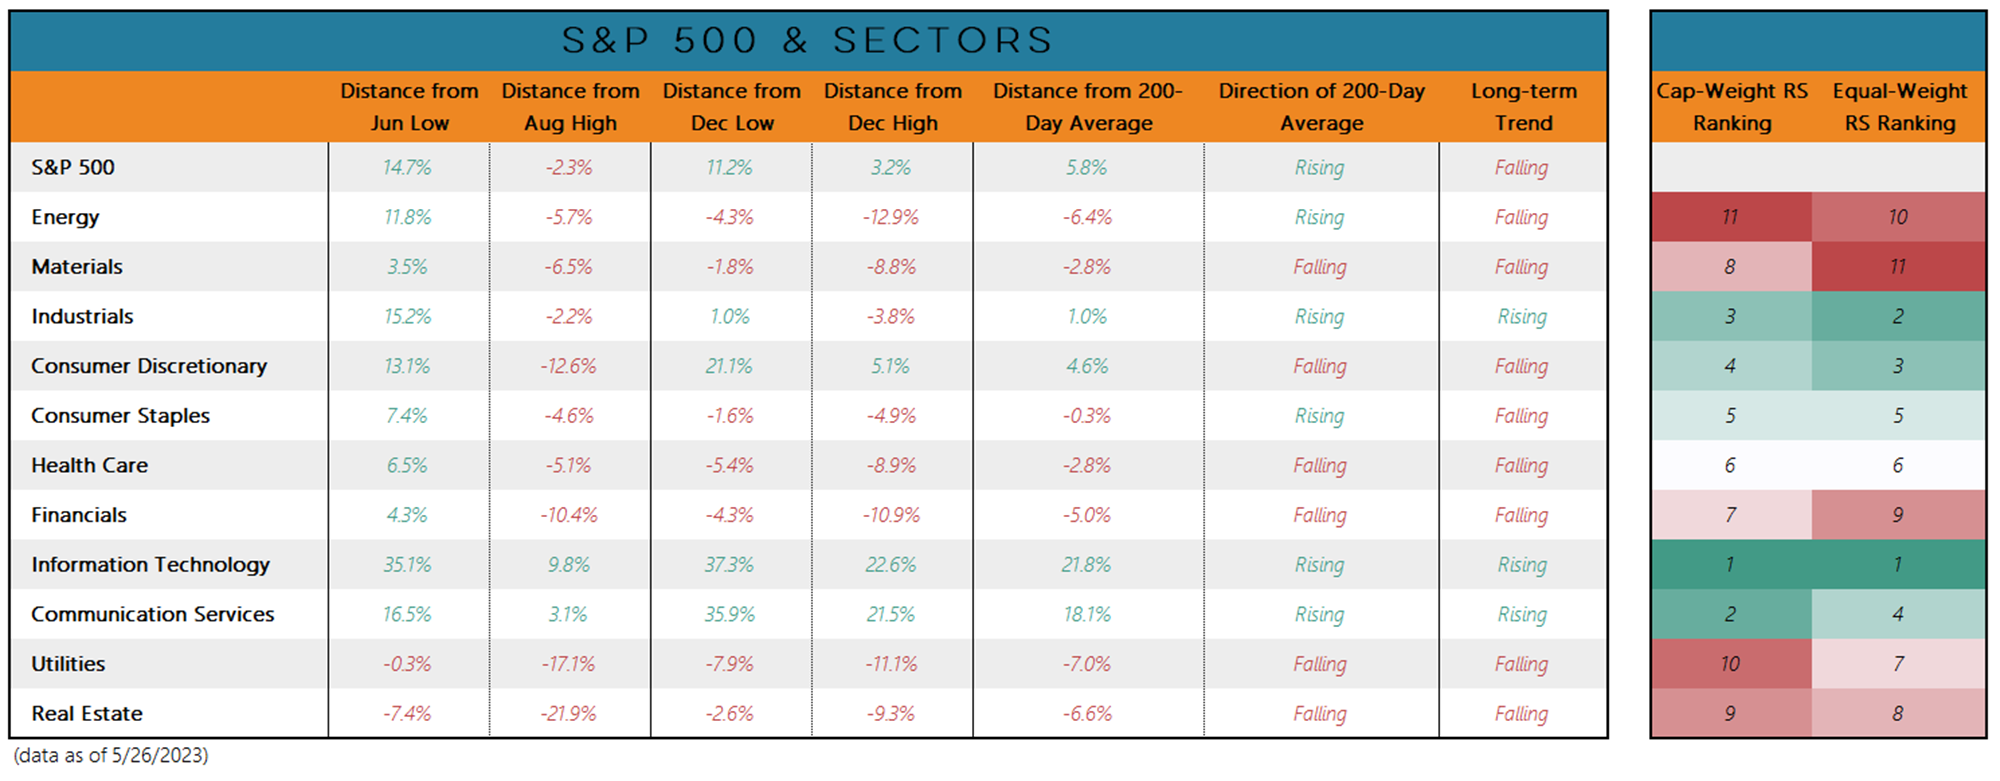
Technology is in the lead from a relative strength ranking perspective, and at the index level its size (31% if the index) more than overwhelms weakness seen elsewhere. But even with Tech’s contribution, the S&P 500 remains within the range established by last summer’s highs and lows. While Tech has been getting going, more sectors are giving back recent strength and dropping below their 200-day averages.

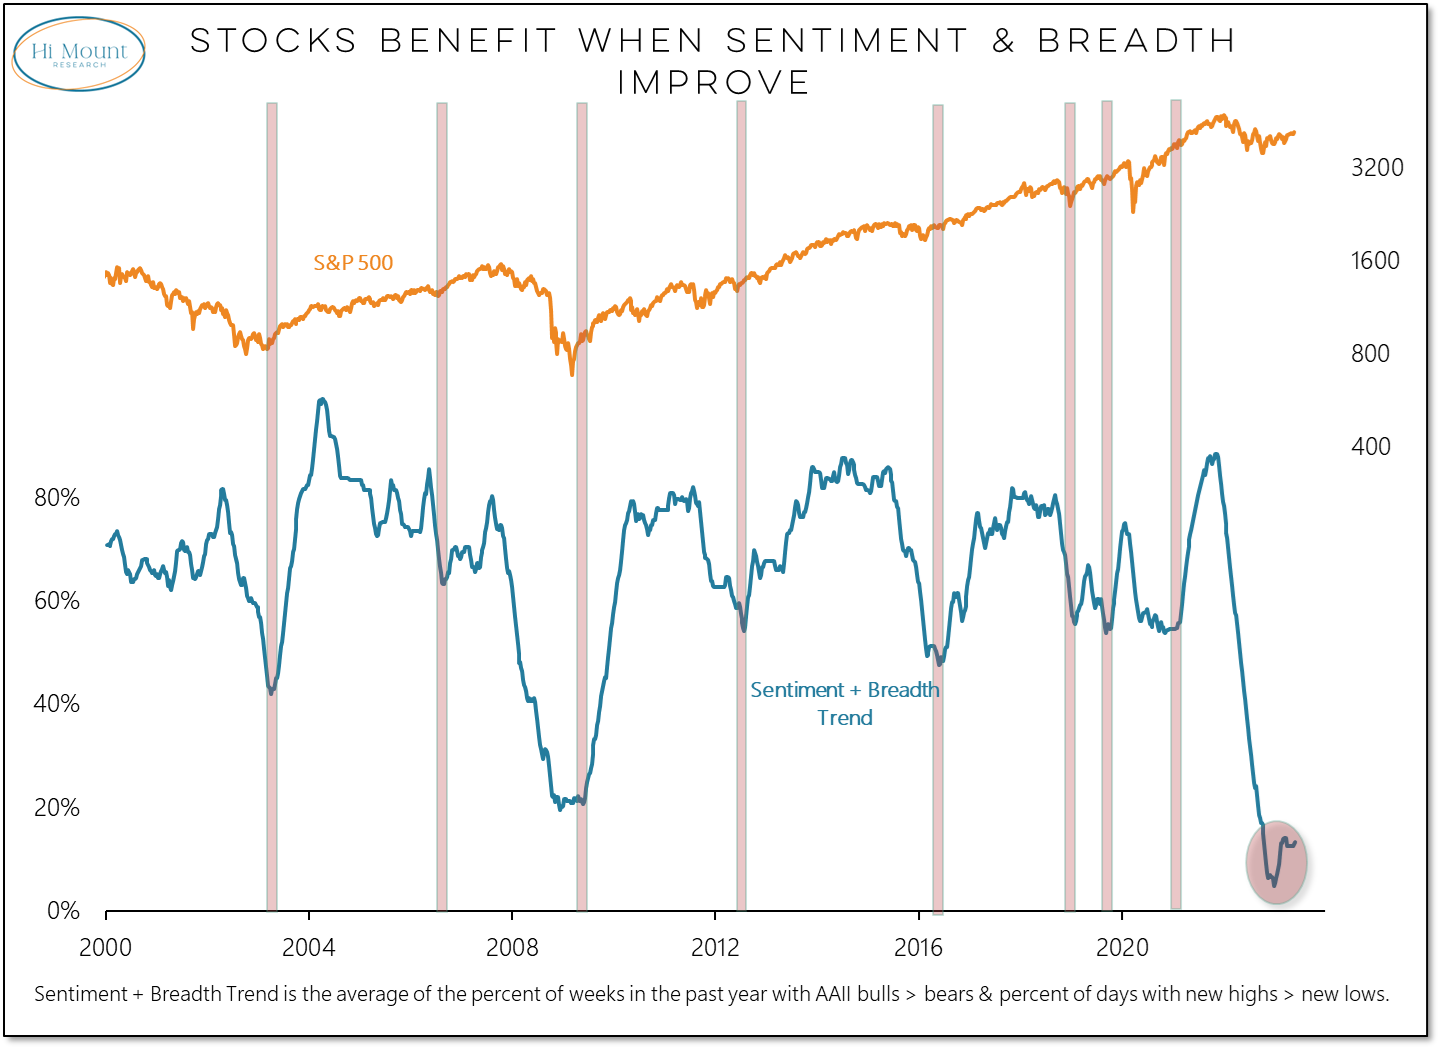
What’s Missing? History is clear – while fear can spark a rally, index-level strength and is more likely to be sustained when it is embraced by investors and breadth turns supportive. Right now, the sentiment surveys show unhelpful levels of skepticism and breadth, by an number of definitions and calculations, is inconsistent with bull market behavior.

For additional perspective, review our latest Weekly Chart Pack.


