

Key Takeaway:
Falling bond yields could support an improving liquidity backdrop later this Spring, but for now US equities are caught between a modern day Scylla (rapidly deflating mega-caps) and Charybdis (broad market weakness). The inability of the post-election rally to produce a new breadth thrust continues to loom large and the absence of a Breadth Thrust Regime has the market operating without this important tailwind for the first time since mid-2022.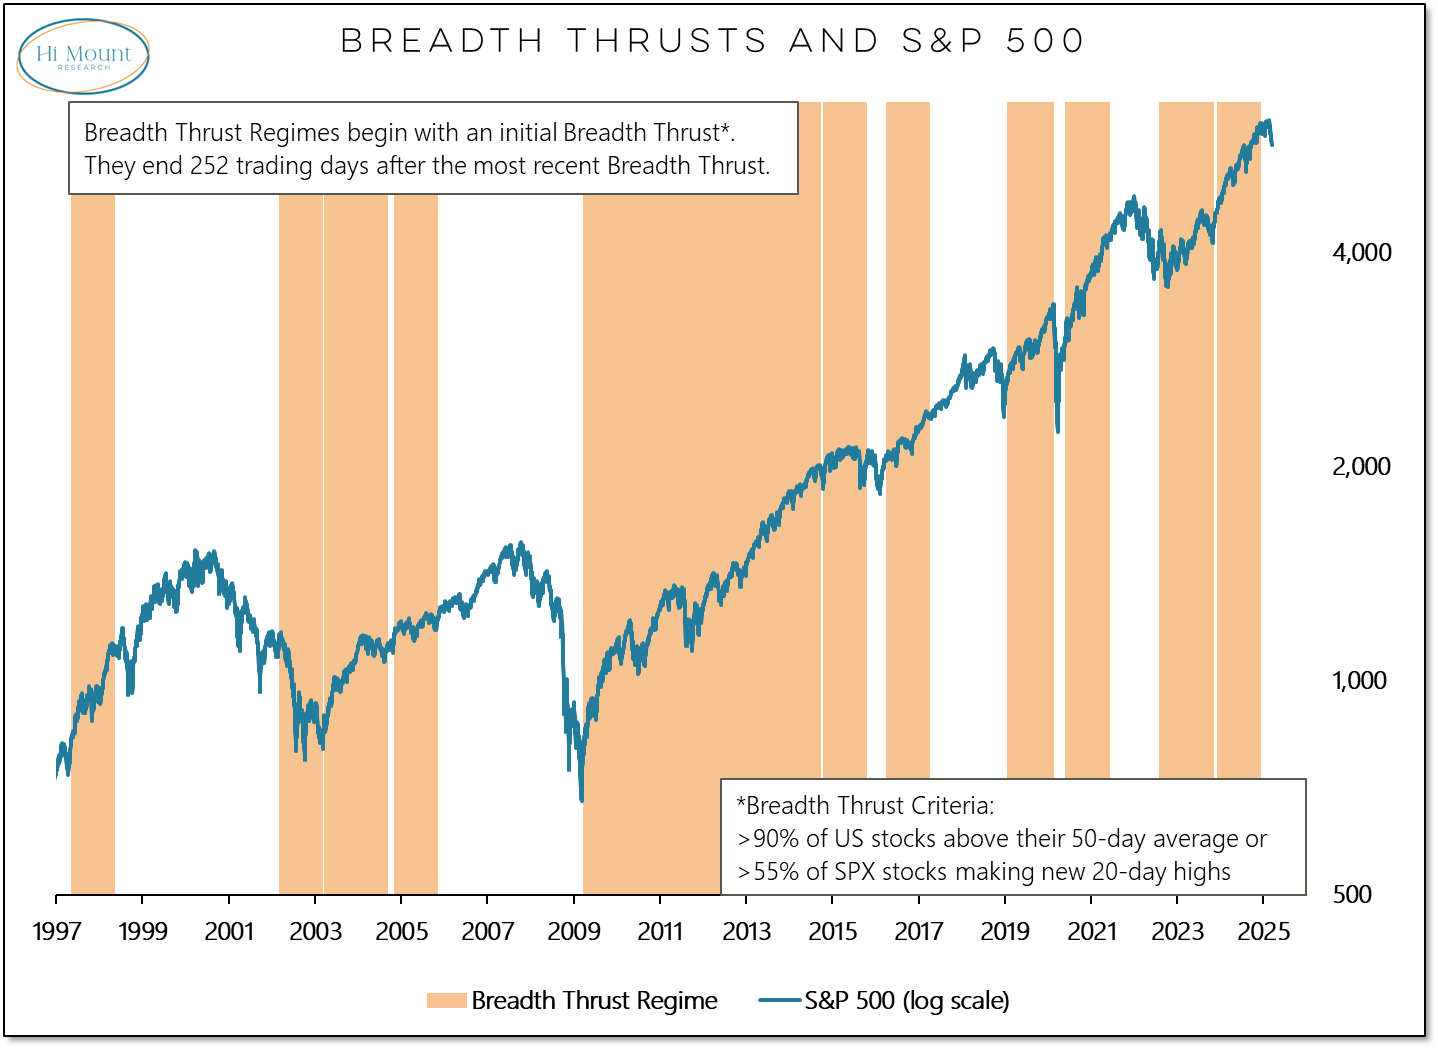
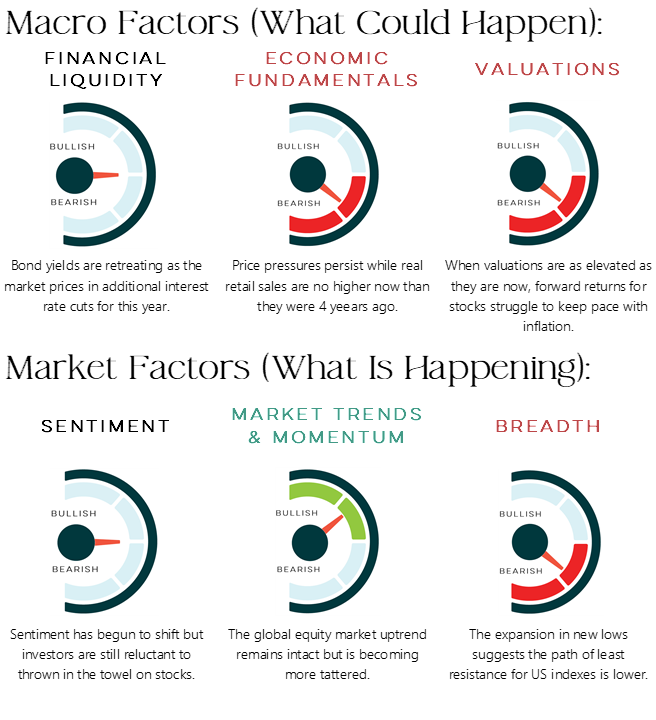
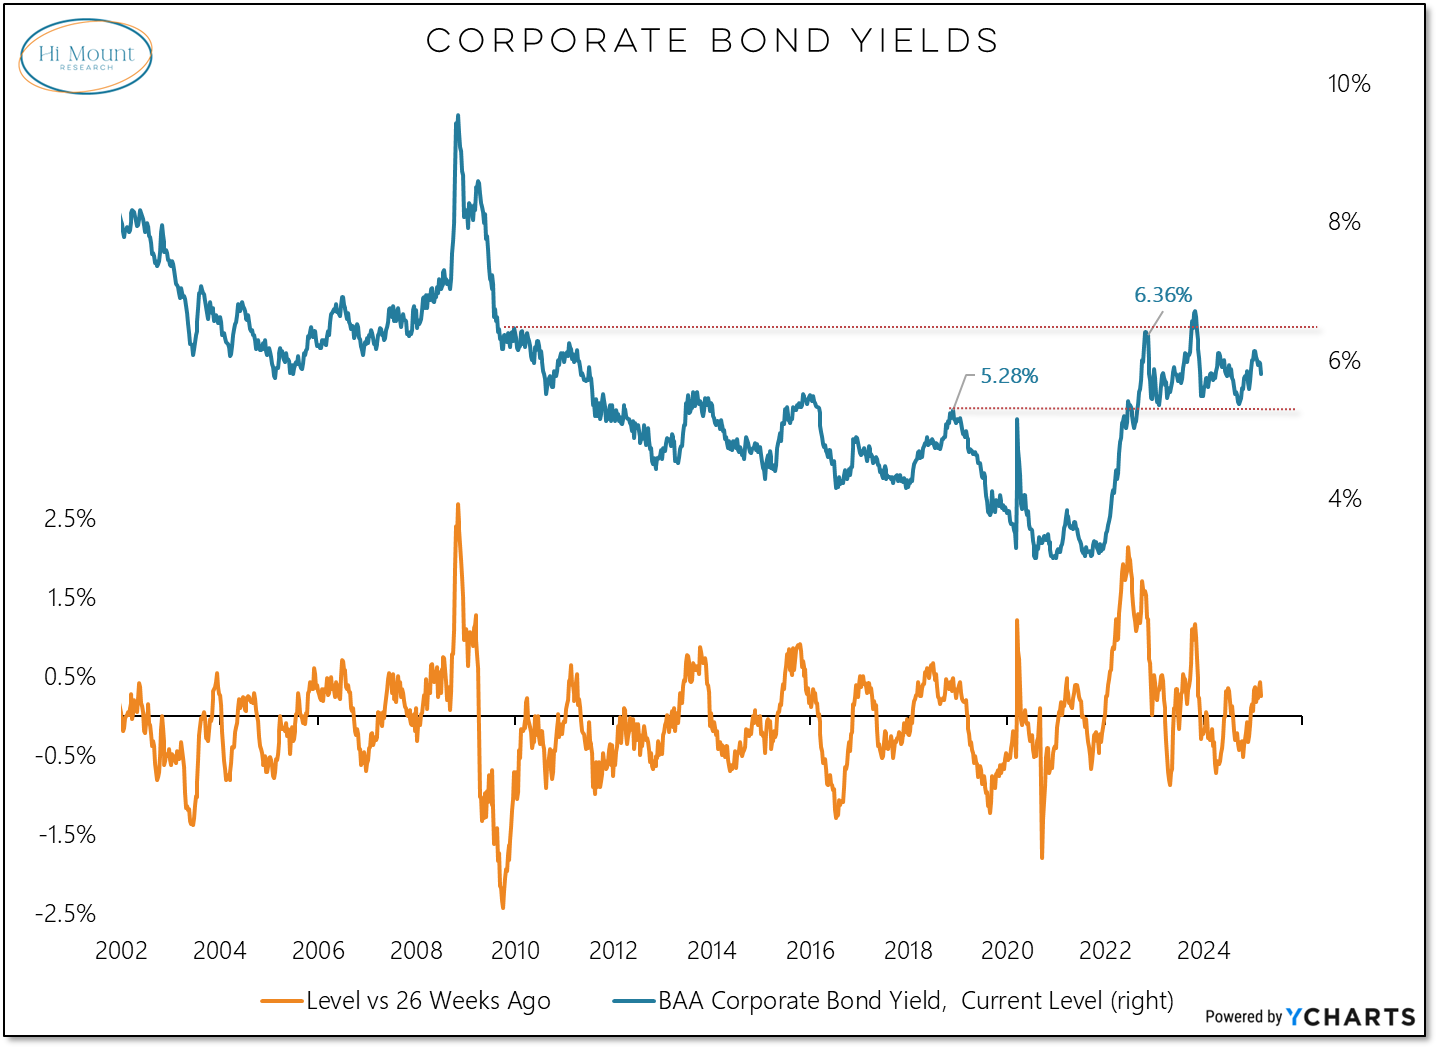
Liquidity:
Corporate bond yields have pulled back from their recent peak but remain higher than they were 26 weeks ago. This indicator doesn’t turn bullish until the 26 -week change in yields turns negative.
Economic Fundamentals:
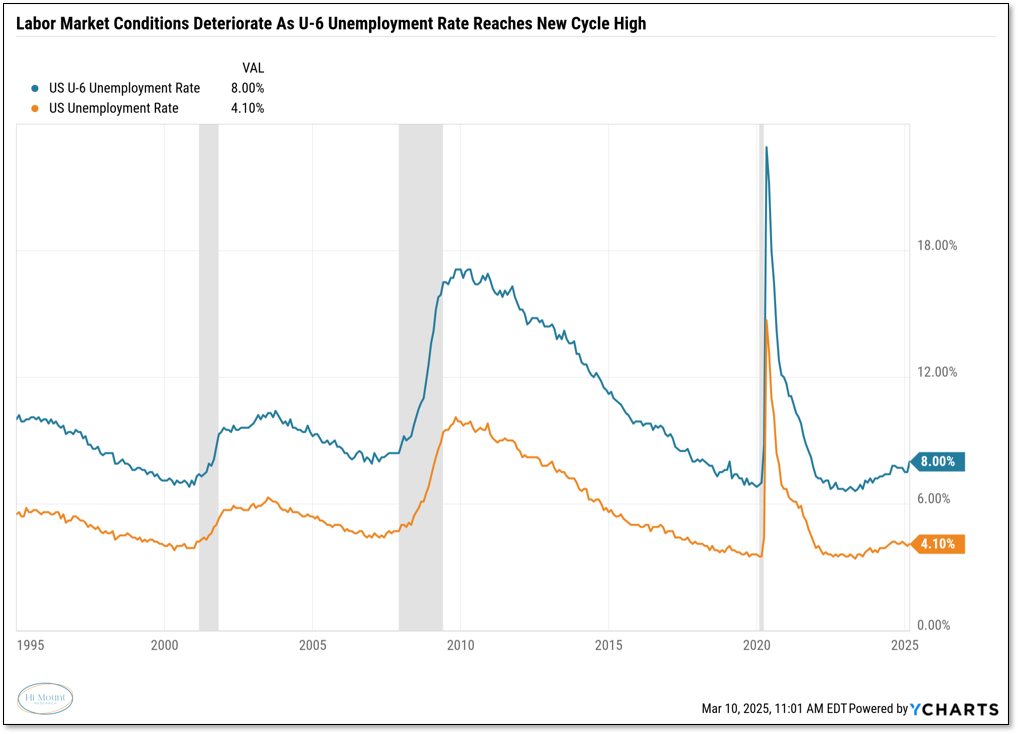
The official unemployment rate ticked higher last month, but it failed to fully capture the deterioration in the labor market. Full-time employment declined by 1.2 million workers last month. Half of those moved to part-time employment and the remainder appear to have lost their jobs (some stayed in the labor force (and are counted as unemployed) and others became discouraged (and dropped out of the labor force). The U-^ unemployment rate captures this deterioration and has climbed to a new cycle high.
Valuations:
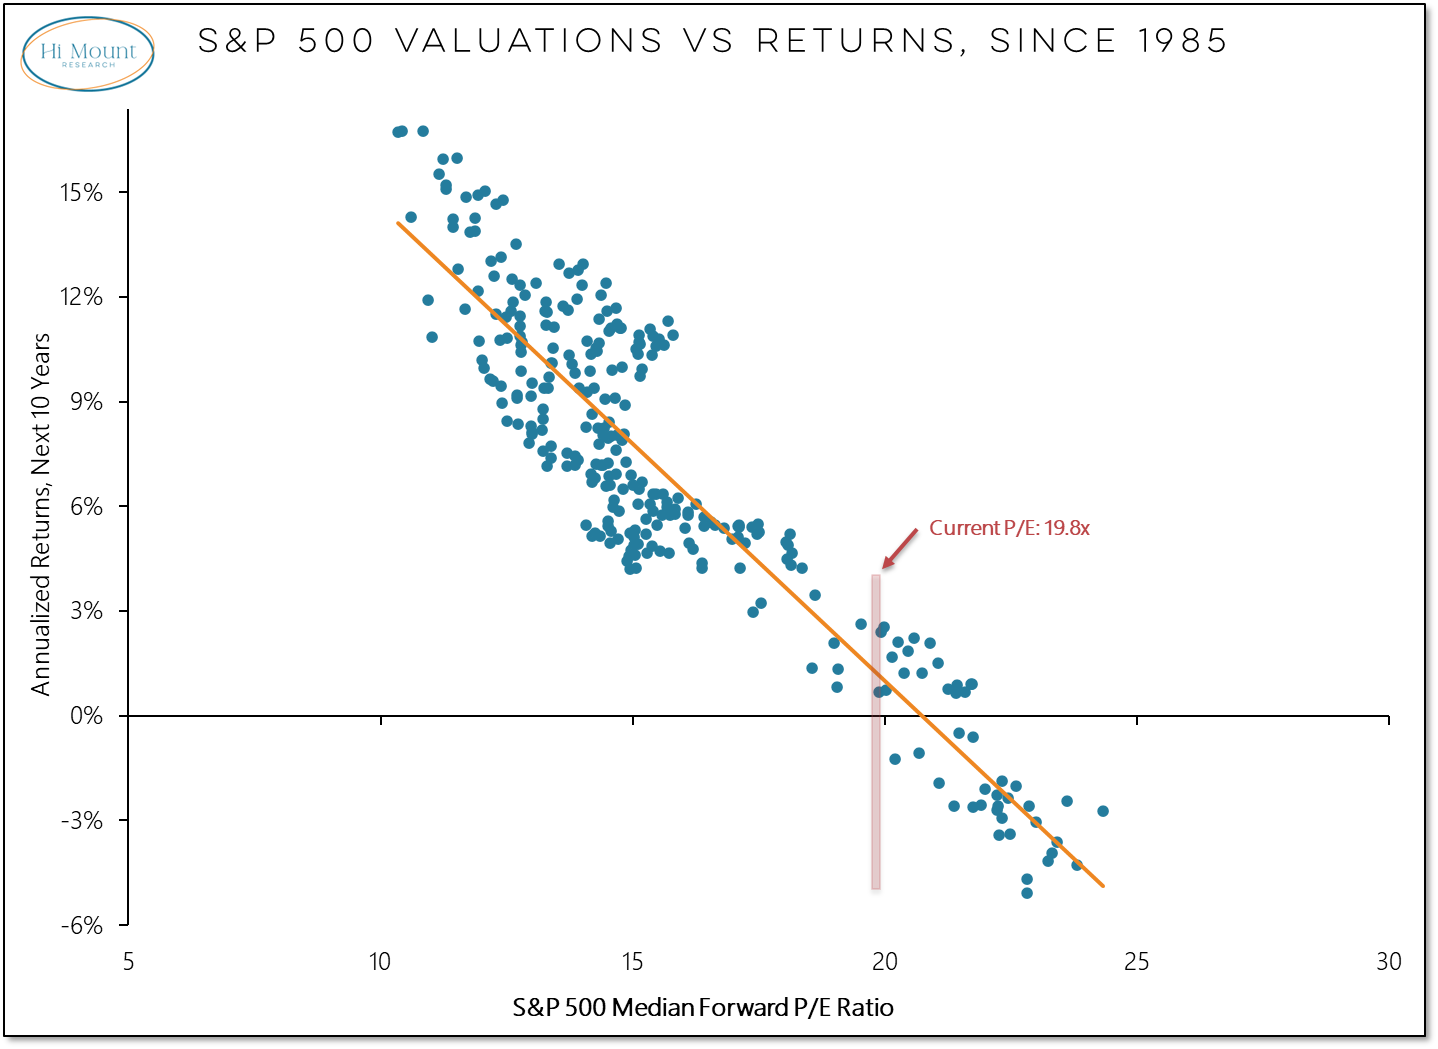
The median forward P/E ratio for the S&P 500 is just shy of 20, which, in the past, has been consistent with forward S&P 500 returns that do not outpace inflation. With economic conditions deteriorating, there is plenty of room for earnings growth estimates (which are currently approaching 20%) to move lower.
Sentiment:
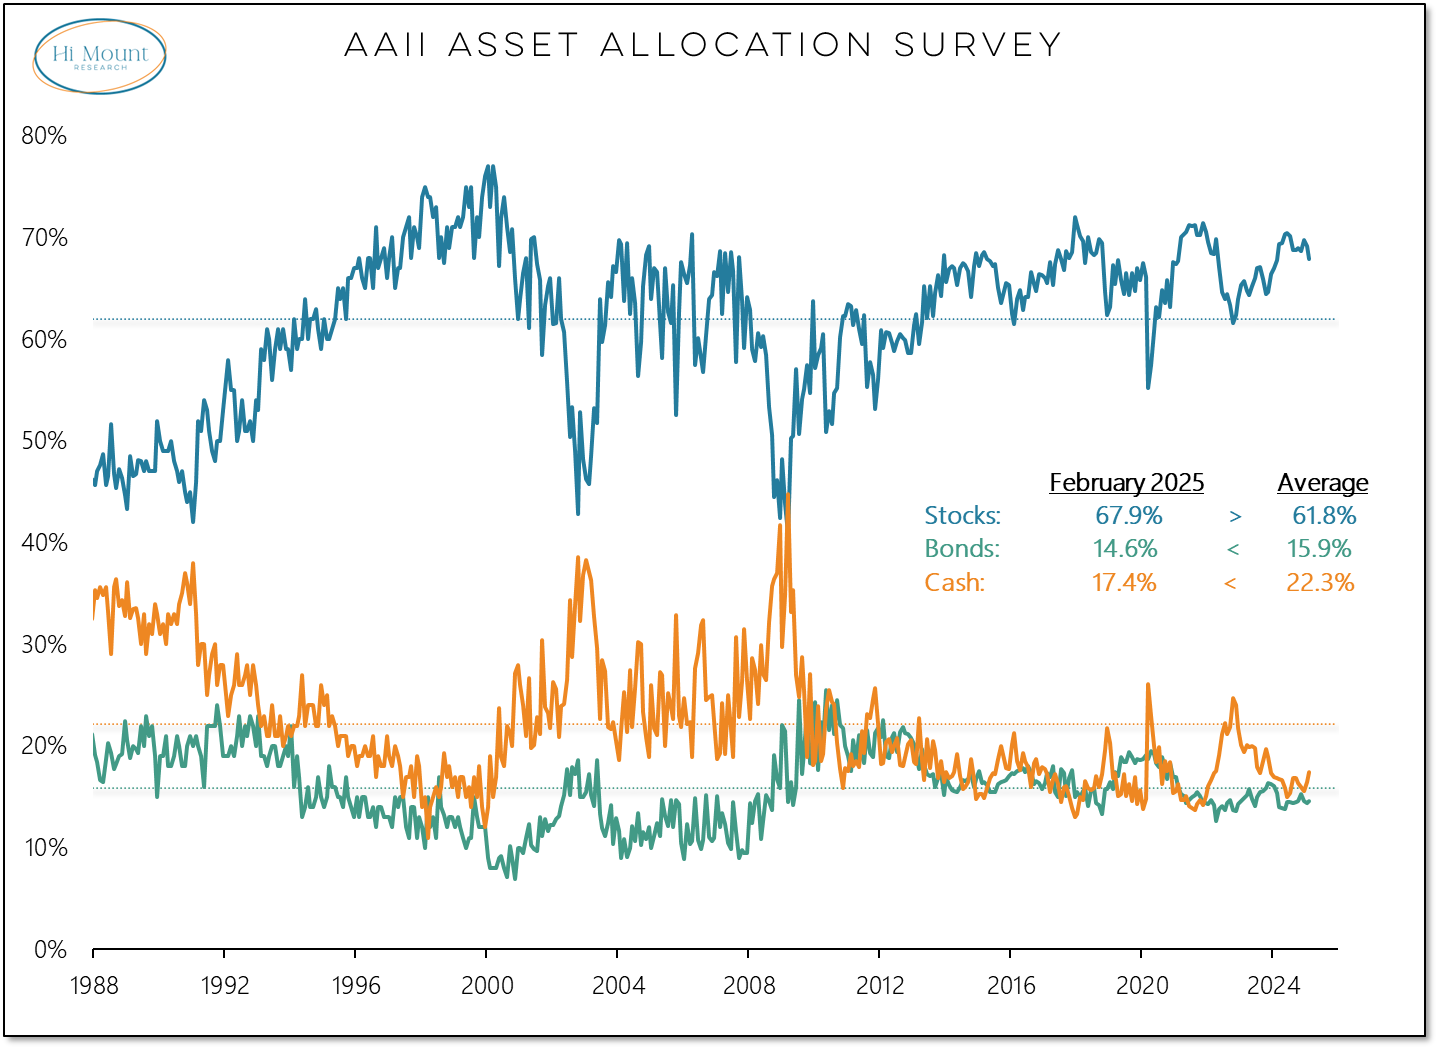
It takes bulls to have a bull market and right now bulls are talking about heading for the exits. AAII bears recently jumped above 60% (one of the highest readings ever on that survey). Other sentiment surveys reflect a more muted retreat in optimism. Moreover, while investor moods have soured, they haven’t re-allocated way from stocks. Of the five previous occasions when AAII bears were above 60%, four of them came with AAII equity exposure below 50%. As of the end of February, it was still 68%.
Market Trends & Momentum:
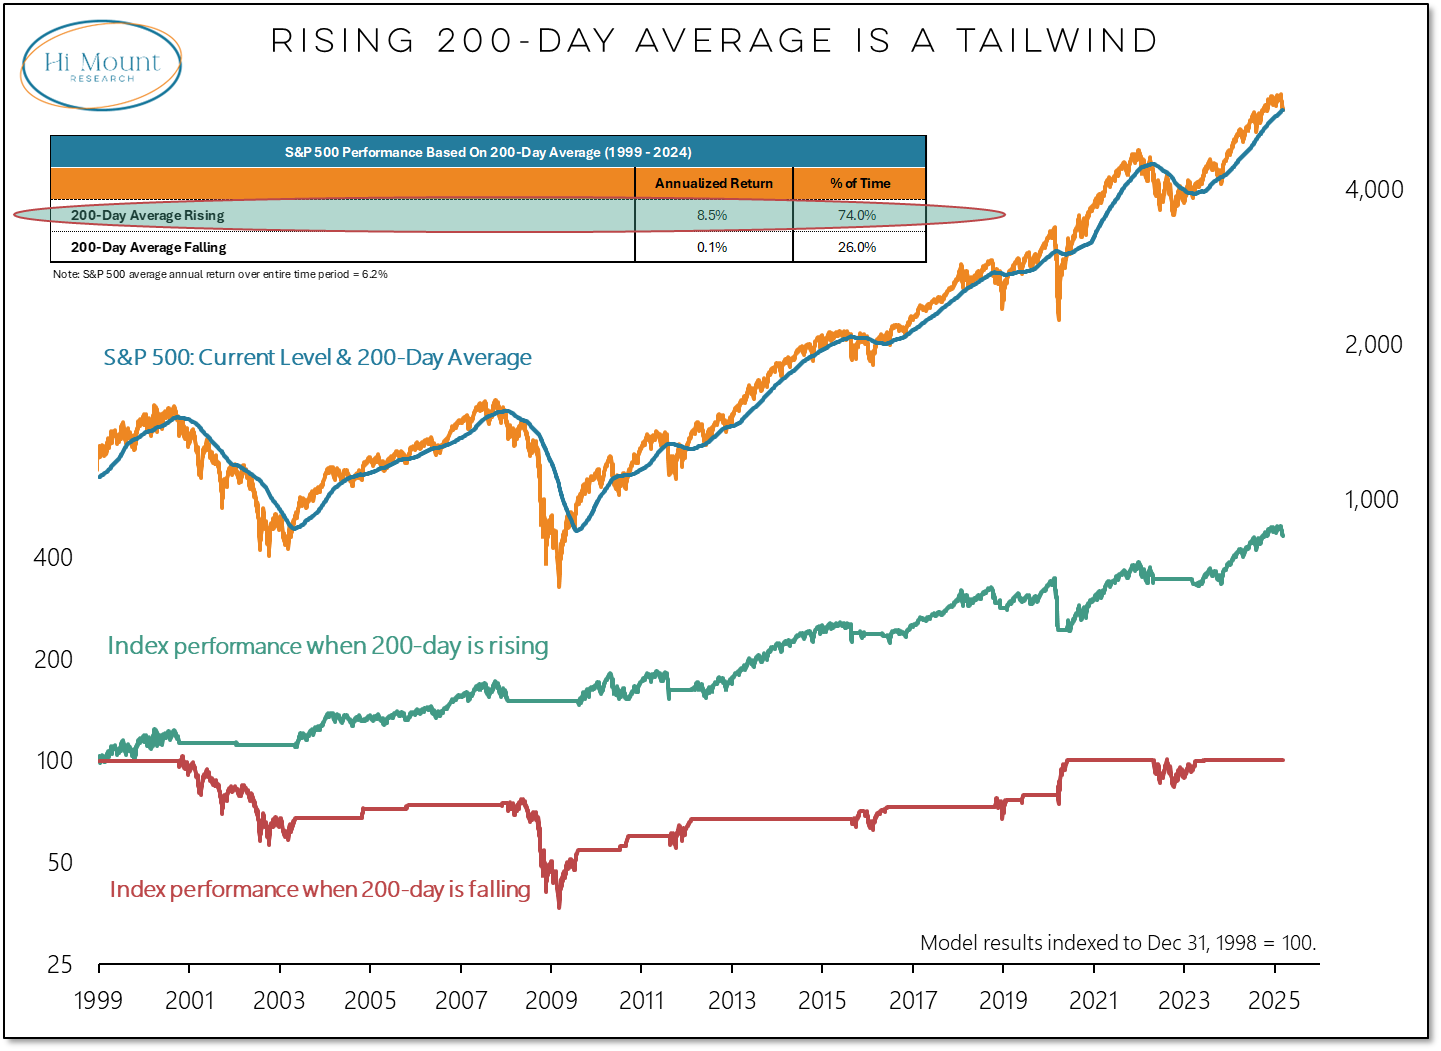
The long-term trend in the Value Line Geometric Index has turned lower and the S&P 500 is now trading below its 200-day average. But global equity market trends continue to rise and for the S&P 500, whether the index is above or below its 200-day average is largely noise. What really matters is the direction of the trend and for now that continues to be higher.
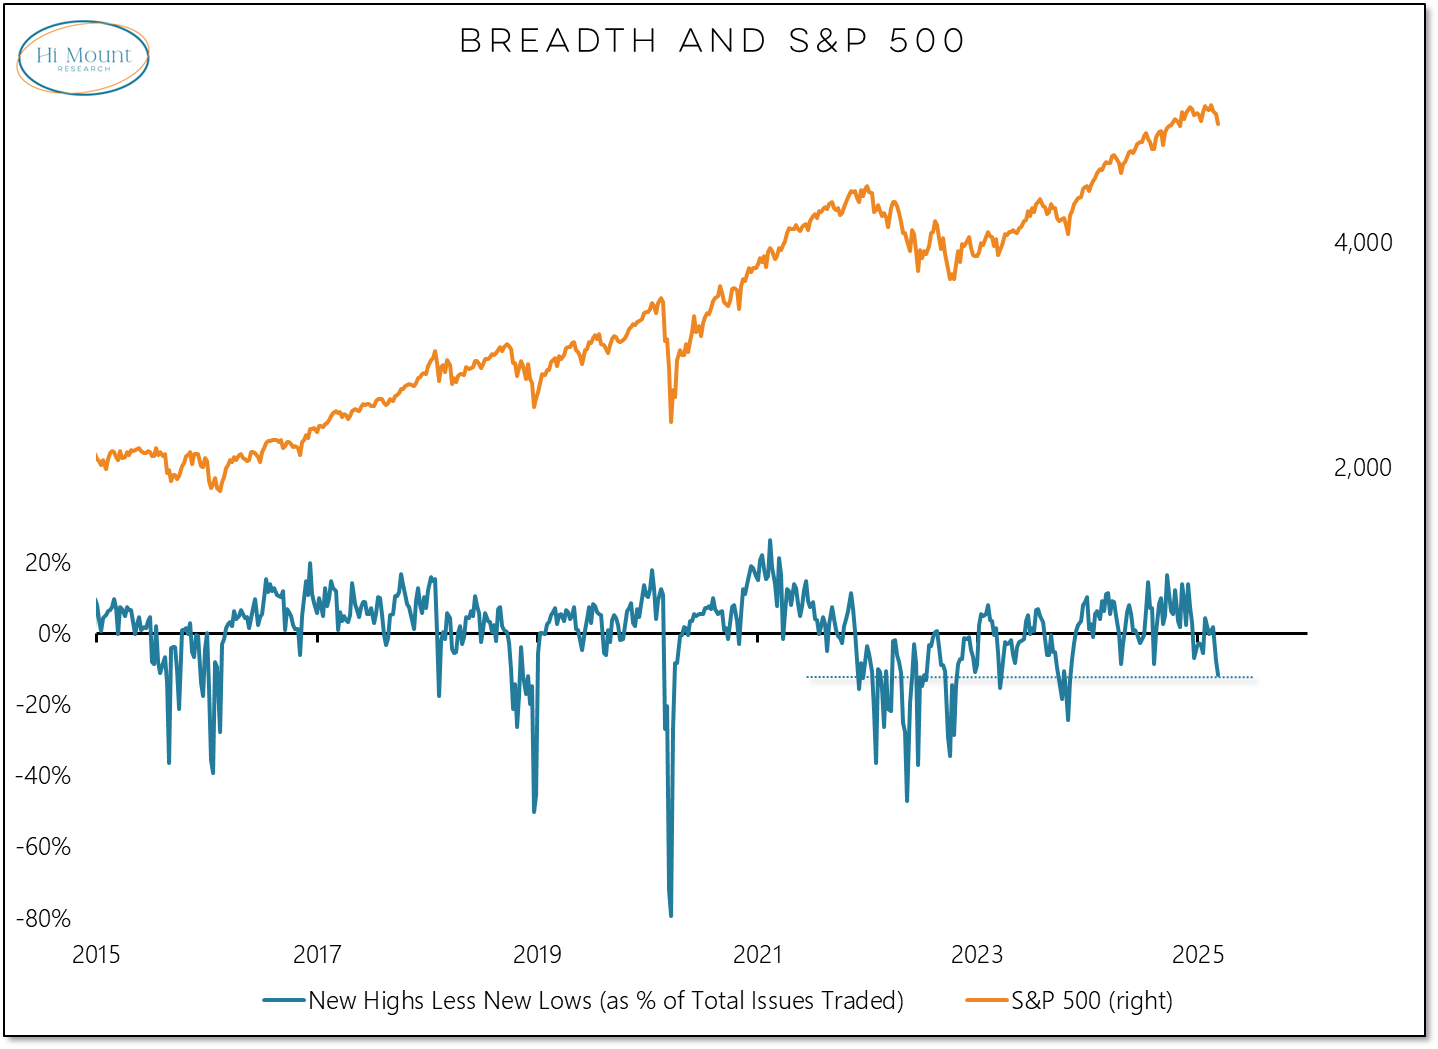
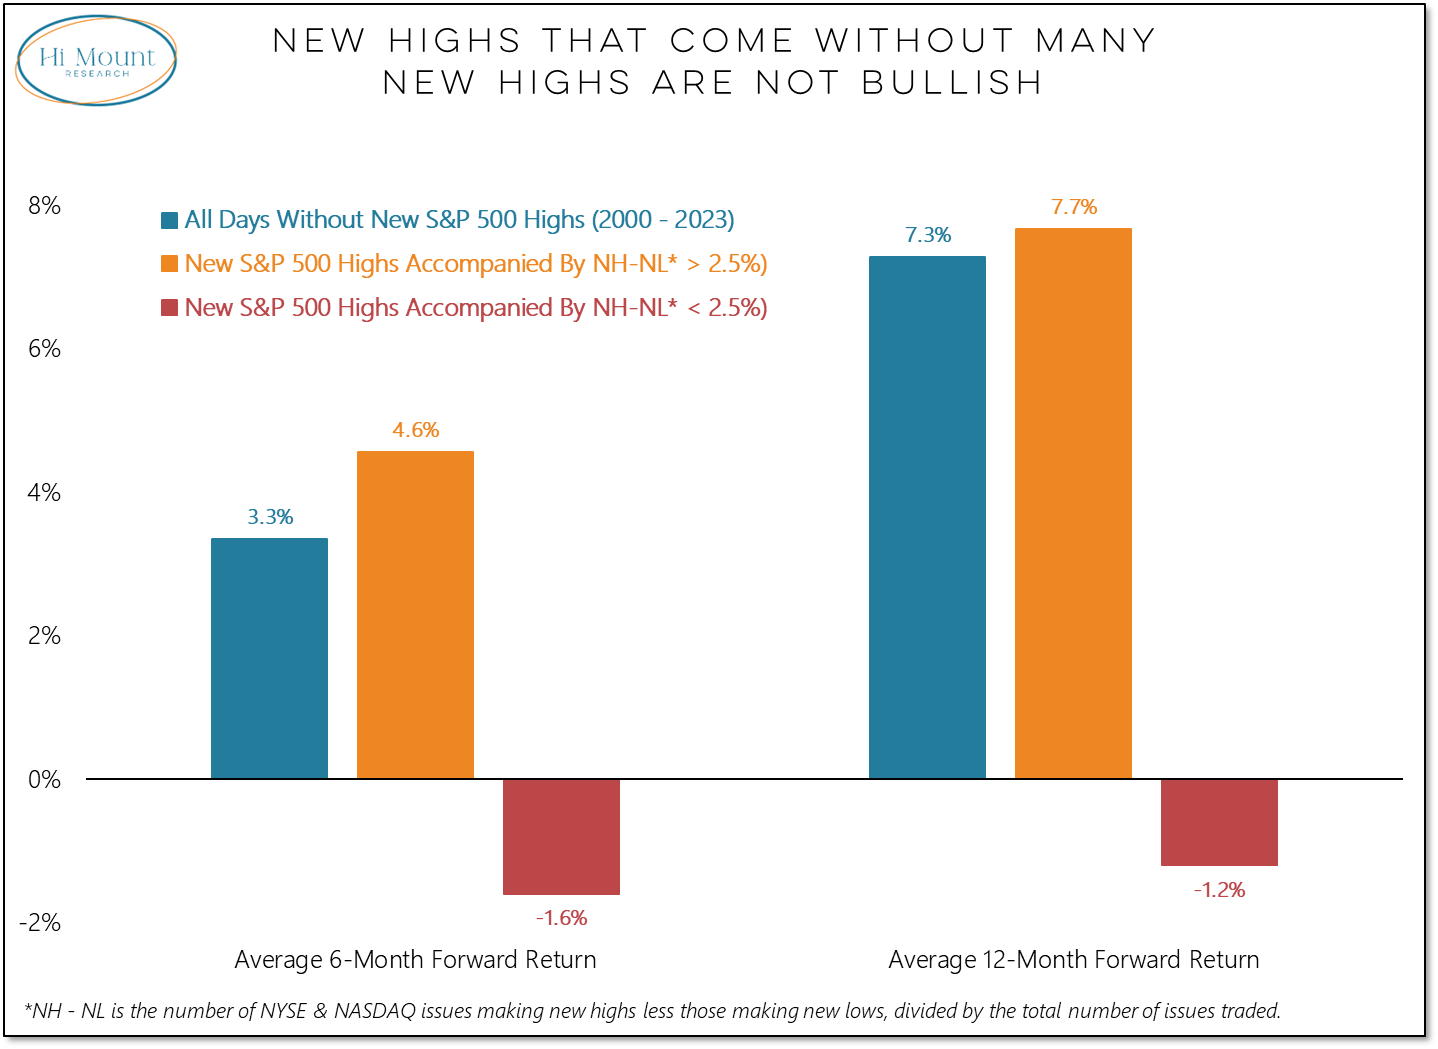
Breadth:
The new high list failed to confirm the S&P 500’s new high in February and new highs that come without new highs are not bullish. Since then, new lows have been expanding and suggest that the path of least resistance is lower. This is not the behavior of a healthy bull market.
