Great Blue Herons. I’ve watched them my entire life and now see them regularly as we walk around the lagoon at the park near our house. They embody two important traits: knowledge of where to fish and understanding of when to strike. The heron does not suffer from wasted movement or frantic busyness. There is plenty of careful and considered observation.
This is the metaphor for our approach to dynamic asset allocation. Get a sense of the environment, be positioned for success, and move when the odds are in your favor. Motionless is not passivity, endless action is usually not productive. Be stubborn enough to trust the process and find the opportunity. Be flexible enough to recognize when it is not working. Keep an open mind and adapt as necessary.
Our Blue Heron Equity Model is a composite of the 7-way regional equity model and the 6-way US equity size/style model. The US exposure in the 7-way regional equity model is distributed among large-cap growth, large-cap value, mid-caps and small-caps as dictated by the US equity model. Our Blue Heron Fixed Income Model is a 7-way model for allocating bond market exposure.
These are standalone models that allow users to customize overall equity and fixed income exposure levels based on investor risk tolerance.
A couple of notes before we get to the models:
- The actual minimum, maximum and average exposure reported by the models is a function of the absolute and relative price trends for the various model components. Constraints are placed on several of the core holdings in the equity models (large-caps and mid-caps in the US model and the US, Emerging Markets and Europe in the regional model) to prevent exposure from dropping to zero. Additionally, the models will always have at least some exposure to all components that are in absolute up-trends.
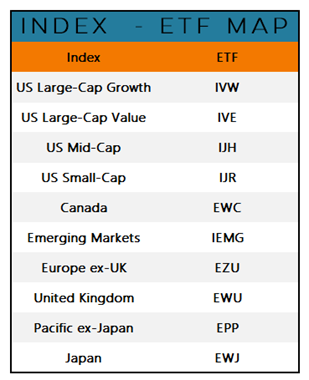
- These models are based on weekly data. Discretion will be exercised over whether the changes suggested by the model will be enacted in the related portfolios. In other words, small weekly tweaks to the models will likely not be reflected in either the Fixed Income or Equity ETF Portfolios, but larger changes will be. The portfolios will be brought into alignment with the models at the beginning of each month. The models were developed using indexes, but the portfolios are managed via ETF’s. For ease of application, each model component has been mapped to a single ETF.
Blue Heron Fixed Income Model
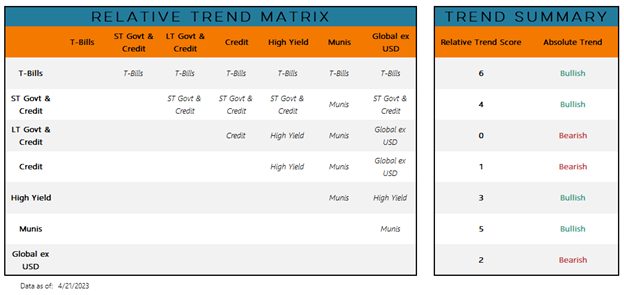
The Relative Trend Matrix (below) shows the pairwise relative strength among the various components. T-Bills, for example, are in a relative uptrend versus all the other components except for Munis (producing a Relative Trend Score of 5). It also shows that the absolute trend for T-Bills is Bullish.
On the opposite extreme, the Relative Trend Score for Long-term Govt/Credit is 0 (indicating that it is not an uptrend relative to any of the other components) and the Absolute Trend is Bearish.
20+ years of data produces the following results for the model. Exposure to the various components has averaged between 11% (Global ex USD) and 17% (T-Bills).

The four model components that are currently in Bullish Absolute Trends (T-Bills, ST Govt/Credit, High Yield and Munis) all have current exposure in the mid-20’s. The model currently has 0% exposure to Long-term Govt/Credit (which has a RTS of 0 and a Bearish absolute trend).

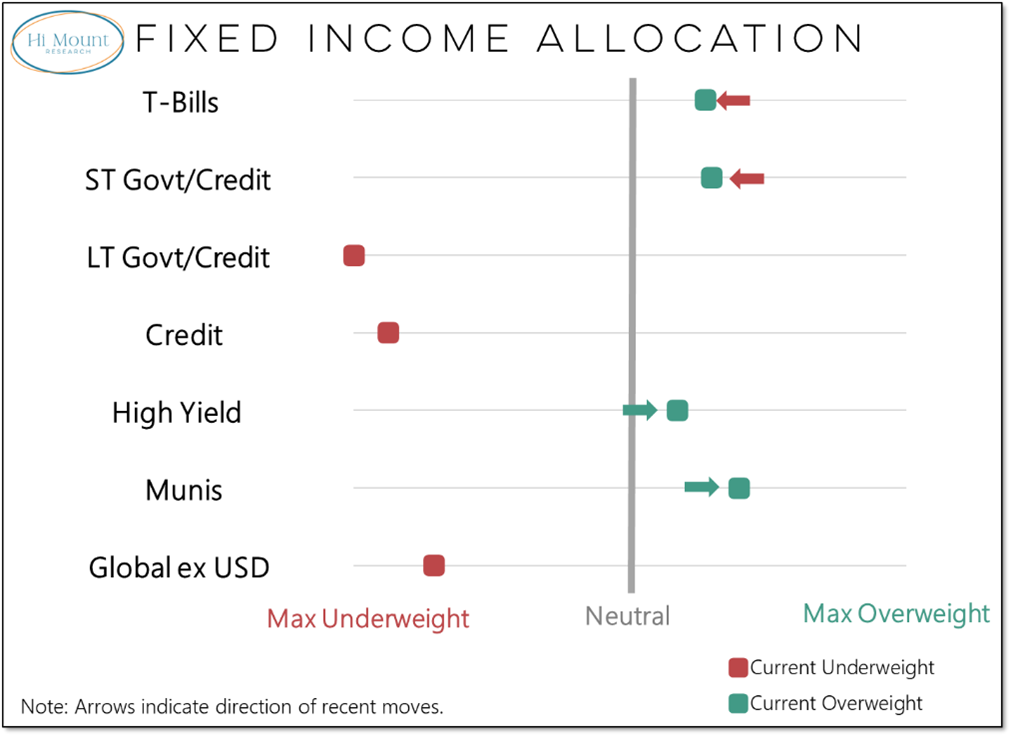
We can also look at positioning from the perspective of relative overweights and underweights. The recent improvement in the absolute trends for High Yield and Munis has pushed them into overweight territory. T-Bills and ST Govt/Credit remain overweights, but less decisively now than when they were the only two components with bullish absolute trends.
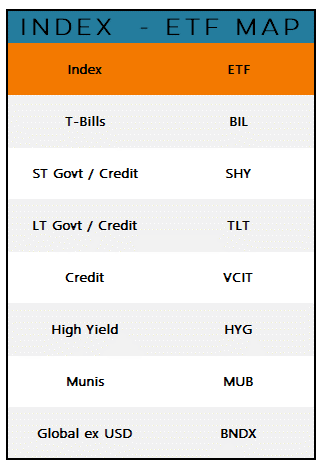
Moving from model to portfolio is a matter of mapping from index to ETF and then listening (with discretion) to the data. ETF’s are chosen for liquidity and longevity, but it has long been my view that general allocation matters more than the specific instrument.
Blue Heron Equity Model
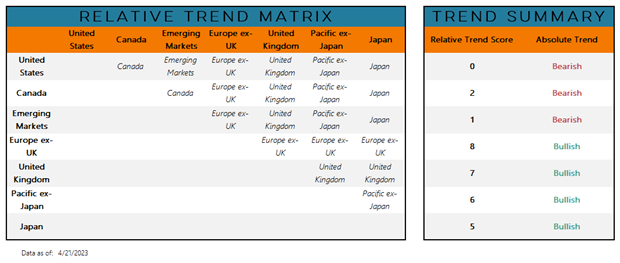

For the overall equity model, the growth and value exposures for both mid-caps and small-caps are combined into single size-based model components. Over the model’s 2+ decades of history, US equity exposure has averaged 55% and global equity exposure has averaged 45%.
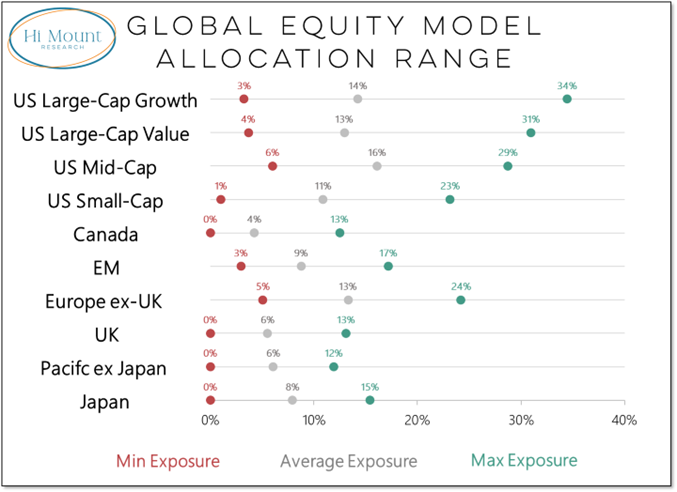
Current US equity exposure in the overall model (45%) is approaching its minimum threshold (42%), but exposure to Large-Cap Value actually comes in above average (given its bullish absolute trend and strong relative trend score). The areas within the global equity market with bullish trends also get current exposure that is toward the high-end of the historical range.
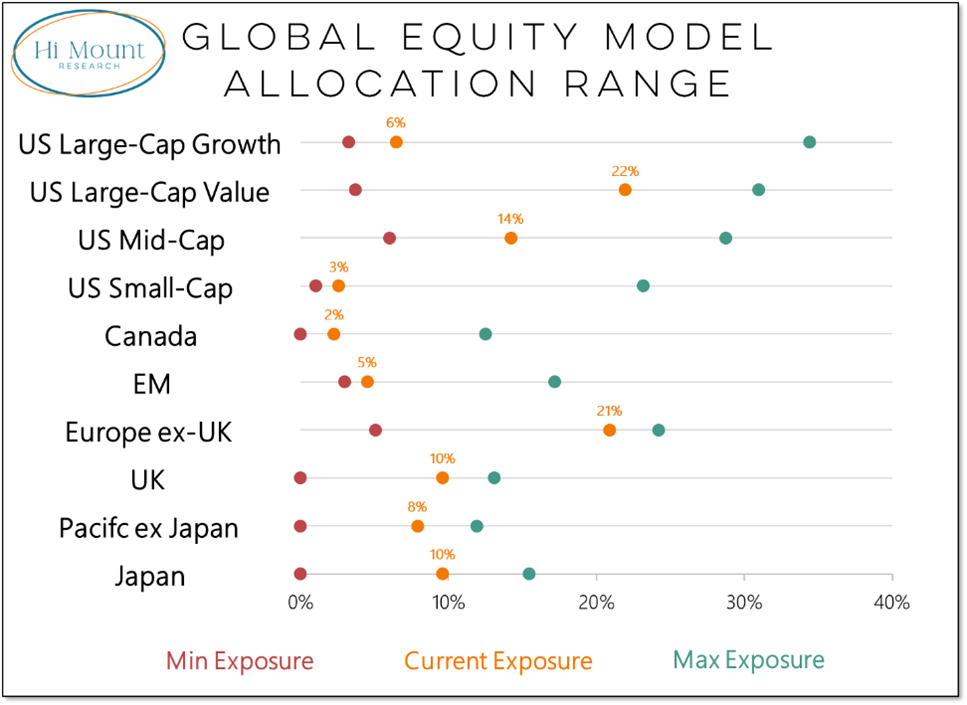
Whether US equity components are overweights or underweights depends their own trends (absolute and relative to each other) as well as the overall strength of the US (absolute and versus the rest of the world).
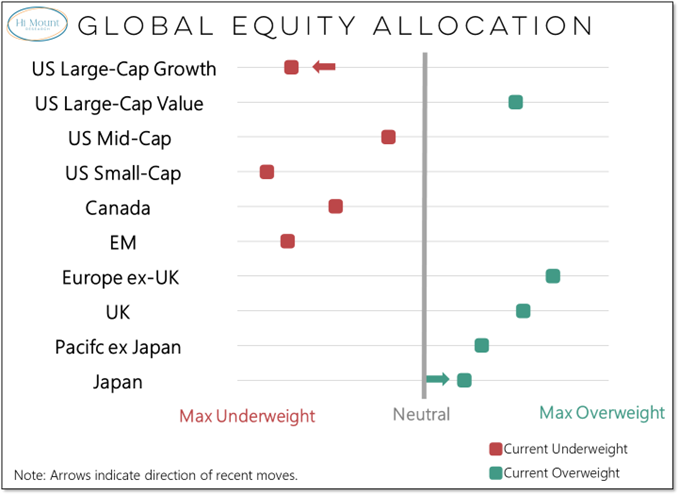
The overall equity model is comprised of 10 ETF’s: six for the non-US global regions and four for the US. This helps simplify the portfolio management approach by dropping the number of components from 12 down to 10 and helps ensure ample liquidity for each position.
The Equity and Fixed Income portfolios can be used to provide more dynamic asset class exposure within an otherwise static asset allocation model.
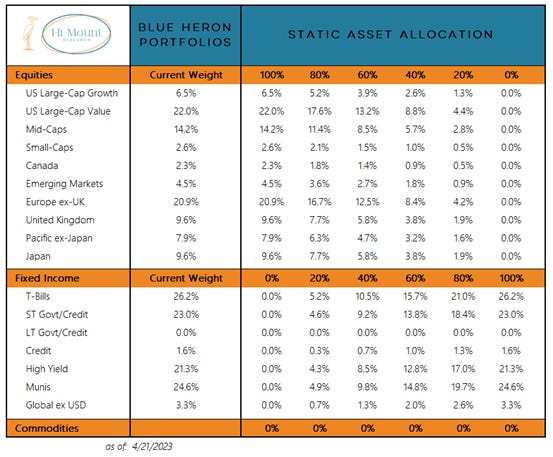
These portfolios can be more powerfully utilized within the context of an overall dynamic asset allocation.
